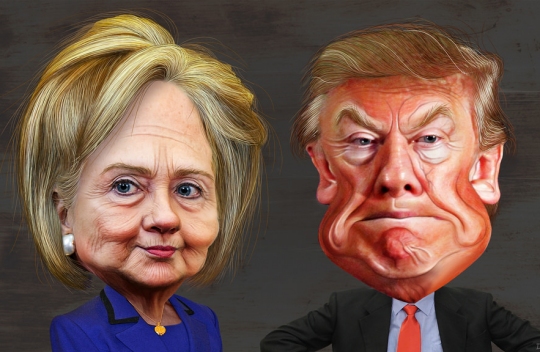
 Caricatures by DonkeyHotey with Flickr Creative Commons License.
The reasons for the election of Donald Trump as president can be better understood by an analysis of voting patterns in Maryland counties. Hillary Clinton received 60% of the total Maryland vote and President Trump 36%. However, 17 of the 24 Maryland counties voted for Trump and 7 voted for Clinton.
An analysis of the counties that voted for each candidate found little influence of campaign issues and little change in voter behavior compared to the 2012 presidential election.
Maryland is distinguished by the great variety in its regional economies. The Baltimore area, once a world famous manufacturing center, has become a typical 21st century "eds and meds" metropolitan area with its institutions of higher education, including medical and other professional schools, and its medical care facilities. The Social Security Administration and the Centers for Medicare and Medicaid Services complement these industries.
This transition has greatly reduced the number of jobs in manufacturing industries.
The Washington suburbs provide homes to many employees of the federal government and the organizations that service the federal government. The other counties have retained their traditional characteristics. The largest industry on the Eastern Shore and Chesapeake Bay counties continues to be tourism, with some fishing and poultry farming. The three western counties retain their agricultural character.
Where they won
Hillary Clinton received the largest percentage of votes in every county in the Baltimore-Washington corridor, including Baltimore City (85%), Baltimore County (57%), Howard County (64%), Montgomery County (76%), and Prince George's County (89%). Anne Arundel County, with the state capital and on the eastern border of the corridor, gave 48% of its votes to Clinton and 47% to Trump. Frederick County, on the western border, gave 49% to Trump and 45% to Clinton. The Eastern Shore and the western counties all voted for President Trump except for Charles County (located just below Prince George's County).
The counties that voted for President Trump had certain characteristics. Compared to the counties that voted for Clinton, they were more rural, had more older residents, fewer college graduates, lower per capita incomes, and fewer black residents. Their unemployment and poverty rates in 2014-2015 were similar to the counties that voted for Clinton. Foreign born residents constituted no more than 6% of the population in practically all of the Trump counties.
The counties that voted for Clinton were more urban and had higher per capita incomes, higher proportions of college graduates, and smaller proportions of older persons. They had much higher proportions of foreign born and black residents, but these two groups were very different. The foreign born residents lived in counties with higher proportions of college graduates and higher per capita incomes. The counties in which black voters lived were much more diverse in their proportions of college graduates and the incomes of their residents.
Trump counties had few of his key issues
The most striking feature of the counties that voted for President Trump is that they did not have some of the key issues that he raised in the campaign. The counties were not in economic distress because their unemployment and poverty rates were similar to the counties that voted for Clinton. An insignificant proportion of their residents were foreign born and took very few jobs from American born workers. Most of the counties did not have manufacturing firms that could have lost jobs to foreign companies.
The counties that voted for Clinton had adapted to a 21st century economy. They provided substantial employment in service industries, including many that depend on government. The replacement of manufacturing firms with service firms in the Baltimore area did not affect her voting support from Democrats. Clinton also won the majority of votes in wealthy counties that tended to vote Republican.
Exact duplicate of 2012
The 2016 presidential election at the county level in Maryland was an almost exact duplicate of the 2012 presidential election. Every county that voted for the Republican candidate in 2016 voted for the Republican candidate in 2012 and the same occurred for the Democratic candidates.
Considering the counties that voted Republican, Trump received an average of 61% of their votes in 2016 compared to 58% received by Romney in 2012. Considering the counties that voted Democratic, Clinton received an average of 69% of their votes in 2016 compared to 68% received by President Obama in 2012. Other statistical measures show an extraordinary degree of continuity in county voting between the 2012 and 2016 elections.
This analysis found that the economy, immigration, and loss of manufacturing jobs to foreign firms were of little importance in the counties that voted for President Trump. He retained a majority of the votes of every county that voted Republican in the 2012 presidential election but lost a majority of the votes of every county that had voted Democratic.
It seems clear that most Maryland voters voted for their preferred party rather than the presidential candidate in the 2016 election.
William G. Rothstein is Professor of Sociology Emeritus at the University of Maryland Baltimore County, rothstei@umbc.edu.


